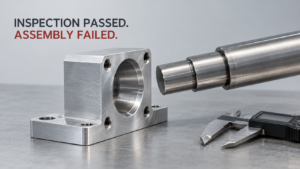
A supplier approves the first article. The shipment passes sampling inspection. The report says critical dimensions received 100% inspection. Then the parts reach assembly, and operators encounter tight fits, misaligned holes, damaged threads, or interfaces that require hand adjustment.
The paperwork may be accurate. The conclusion drawn from it may still be wrong.
Inspection results describe particular checks under particular conditions. Assembly performance depends on whether the delivered parts meet all relevant requirements together, consistently, in their final condition. Those are different questions.
For buyers sourcing machined components internationally, this distinction affects more than rejection rates. It influences incoming inspection, production scheduling, inventory buffers, and the speed of supplier investigations. The practical objective is to connect approval records with manufacturing behavior and actual assembly results.
The numerical sampling example below is hypothetical. It demonstrates a calculation, not a supplier’s measured defect rate. The first-person observation concerns the supplied research materials, not an unverified factory experiment.
1. Inspection Approval Has a Defined Scope
Inspection approval refers to a decision that specified items or characteristics satisfy stated acceptance requirements under the conditions actually evaluated.
That definition sounds narrow because it should be narrow. A report becomes misleading when a limited result is treated as evidence for a broader claim.
Consider the difference between the main approval methods:
| Evidence | What it supports | What remains unproven |
|---|---|---|
| First-article approval | Verified characteristics on the submitted production sample meet requirements | Continued conformity across subsequent production conditions |
| Sampling acceptance | The inspected lot meets the agreed sampling decision rule | Conformity of every unexamined part |
| Inspection of every part | Each item underwent the declared checks, if records are accurate | Coverage and effective detection of every relevant requirement |
These are useful forms of evidence. None should be discarded simply because its scope is limited. A first article can expose programming mistakes before a production run. Sampling can support economical shipment decisions. Effective individual inspection can contain a known defect mechanism.
The purchasing problem begins when those methods become interchangeable in conversation.
For example, “100% inspected” might mean every bore received a diameter check. It might also mean every component passed a thread gauge. Neither statement explains whether the bore position, datum relationship, effective thread depth, or sealing surface was verified.
Piece coverage and characteristic coverage must therefore be recorded separately. Detection effectiveness is another question: a check can cover every item and still use an unsuitable method.
First-article approval also needs a production boundary. Ask which machine, fixture, program revision, material condition, and inspection setup produced the approved result. If later production uses different conditions, the approval package needs an agreed approach for evaluating those changes.
For a buyer, this creates an opportunity to simplify communication. Instead of requesting a larger report indiscriminately, request an explicit coverage statement tied to the drawing. A short, traceable matrix can reveal more than pages of unexplained measurements.
During my review of the supplied research, I noticed that the phrase “100% inspection” left the most important questions unanswered: which characteristics were checked, how they were checked, and whether inspection covered the final delivered condition. My observation is about the evidence presented in the material; it is not a claim that I tested a production batch. It changed the question I would ask a supplier from “Did you inspect everything?” to “Show me how you verified the interface that determines assembly success.”
This approach also makes disagreements more specific. If the supplier checked the agreed features correctly, an assembly failure may expose an incomplete specification or an uncontrolled mating component. Blame should follow evidence rather than the location where the failure appeared.
Action: Before approving production, agree on a drawing-linked inspection matrix stating characteristic coverage, item coverage, method, production condition, and release responsibility.
2. Sampling Acceptance Leaves a Quantifiable Escape Risk
Sampling acceptance refers to accepting or rejecting a defined lot using results from a selected sample and a predetermined decision rule.
The important word is “decision.” Sampling manages acceptance risk; it does not examine every unit. NIST describes sampling plans through operating characteristic curves, which connect a quality level with its probability of acceptance. [NIST — Choosing a Sampling Plan]
Use this hypothetical example to make the risk concrete:
| Parameter | Assumption |
|---|---|
| Lot size | 1,000 parts |
| Actual nonconforming parts | 20 parts |
| Actual nonconforming proportion | 2% |
| Sample size | 80 parts |
| Acceptance number | 0 |
| Rejection trigger | Any detected nonconforming part |
All quantities in this table are teaching assumptions, not observed production results. Assume simple random sampling without replacement, perfect detection of the specified defect within the sample, and no later substitution or mixing. [Supplied Research — Hypothetical Sampling Example]
Under these conditions, the probability of selecting no nonconforming parts is:\[ P(X=0)=\frac{\binom{980}{80}}{\binom{1000}{80}}\approx18.56\% \]
The lot already contains defective parts, yet it has approximately an 18.56% chance of passing this zero-acceptance sampling rule. If it passes with no defects selected, all 20 nonconforming parts remain among the 920 unexamined units. [Supplied Research — Hypergeometric Calculation]
This result is easy to misread. It is the probability of acceptance given the assumed defective lot. It is not the probability that an accepted lot is defective. That reverse question requires additional information about incoming lot quality.
Changing the acceptance number changes the decision risk:
| Acceptance number | Probability of accepting this hypothetical lot |
|---|---|
| 0 | 18.56% |
| 1 | 51.51% |
| 2 | 78.92% |
These results use the same finite-lot hypergeometric model. Accepting a lot after finding a permitted number of defects is different from detecting none. [Supplied Research — Hypergeometric Calculation]
The example is a custom sampling plan. It must not be presented as a plan selected from a particular AQL table.
AQL is also not a measured defect percentage for an accepted shipment. It helps index an acceptance system. Buyers still need to understand the associated consumer risk at quality levels they consider unacceptable. [NIST — Choosing a Sampling Plan]
Random selection matters as much as the arithmetic. Taking convenient parts from the top carton does not satisfy the example’s assumptions. Conversely, physical clustering of defects does not change this calculation when every unit genuinely has an equal chance of selection and the total defect count remains fixed.
Sampling remains valuable when inspection cost, defect consequences, and process evidence justify its use. The opportunity is to choose it deliberately rather than treating a familiar sample size as automatic protection.
Action: Specify the lot definition, random selection method, sample size, acceptance rule, and acceptable consumer risk before using sampling as shipment approval.
3. Manufacturing Variation Can Disconnect the First Article from the Shipment
Manufacturing variation refers to changes in process output caused by production conditions such as tooling, equipment, fixturing, material, temperature, and operator adjustments.
A first article captures a production condition. A shipment may contain output from many conditions. The investigation should identify where those conditions changed and whether the control plan could detect the resulting effect.
The following are engineering failure scenarios, not claims about their frequency across suppliers:
| Change or condition | Possible assembly symptom | Evidence worth requesting |
|---|---|---|
| Progressive tool wear | Increasing insertion force or burr formation | Measurements through the tool cycle |
| Sudden cutting-edge damage | Abrupt dimensional or surface change | Check timestamps and containment records |
| Different machine or fixture | Persistent interface offset | Results separated by production source |
| Incorrect program revision | Repeated mismatch at a changed feature | Revision and setup traceability |
| Finishing after inspection | Changed fit or surface condition | Verification after relevant final operations |
The practical lesson is to retain production order. A spreadsheet sorted from smallest to largest may look tidy, but it removes information about when a change occurred. Preserve timestamps or sequence identifiers alongside measurements.
Separate production sources before interpreting averages. A combined average can sit near nominal while individual machines operate near opposite specification limits. It can also hide a machine producing a distinct population. The remedy begins with source identification, not with a more attractive summary statistic.
There is a commercial benefit here. Better traceability can reduce the volume quarantined during an investigation. If suspect output can be bounded credibly, the buyer may avoid treating every carton as equally uncertain. That benefit depends on reliable records and a justified containment boundary.
Reaction plans should address both the machine and previously produced parts. Correcting an offset fixes future output only if the correction works. It does not automatically release components manufactured since the last reliable check.
Define how the supplier establishes the last known conforming point, handles output produced afterward, and verifies restart conditions. When that point is uncertain, the containment scope must reflect the uncertainty.
Final condition is equally important. A measurement taken before an operation capable of changing the controlled feature may not represent the delivered part. The quality agreement should identify which characteristics need verification after finishing, tratamiento térmico, deburring, or other relevant operations.
Do not assume every process change requires identical paperwork. A risk-based agreement can distinguish routine adjustments from changes requiring renewed approval. Clear triggers protect the buyer while avoiding unnecessary delays for harmless adjustments.
Action: Require production-sequenced records separated by machine and fixture, plus a reaction plan covering suspect output, restart verification, and final-condition acceptance.
4. Capability Indices and Assembly Yield Measure Different Things
Process capability refers to comparing the variation of a statistically controlled process with the specification limits for the characteristic being analyzed.
NIST emphasizes the stable-process basis of capability analysis. A favorable index calculated from unstable or unrepresentative data is weak evidence for future performance. [NIST — What Is Process Capability?]
Under the common within-subgroup convention, Cp compares tolerance width with estimated within-process spread, while Cpk also considers how close the mean is to the nearest specification limit. Pp and Ppk use overall variation from the selected dataset; Ppk also considers centering. [NIST — What Is Process Capability?; Minitab — Overall Capability]
For purchasing decisions, the distinction can be summarized without turning the review into a statistics exercise:
| Measure | Main question | Important boundary |
|---|---|---|
| Cp | How wide is within-process variation relative to tolerance? | Does not assess centering |
| Cpk | How does that variation sit relative to the nearest limit? | Requires defensible data and assumptions |
| Pp/Ppk | What overall variation did the selected data capture? | Cannot represent unobserved conditions |
| Assembly first-pass yield | Did assemblies pass without rework or adjustment? | Depends on defined process and test boundaries |
A substantial difference between within-subgroup and overall variation warrants investigation. Minitab identifies instability or additional variation sources as possible explanations and advises checking control charts. [Minitab — Overall Capability]
Avoid treating Ppk as automatically “long term.” A dataset covering a brief, favorable production interval remains a brief dataset, whatever index is calculated from it. Ask which shifts, material batches, tool conditions, and equipment sources it actually represents.
Likewise, a high capability value for bore diameter says nothing directly about unmeasured bore position. Assembly can depend on the interaction of size, form, orientation, location, surface condition, and mating-part variation.
Some assembly problems originate in requirements rather than manufacturing. If permitted component variation creates an unacceptable combination, tightening inspection against the existing drawing may not solve the interface problem. Engineering must review the tolerance relationship and intended function.
This is where assembly data adds value. For a practical buyer-supplier agreement, define assembly first-pass yield as assemblies passing the stated assembly and functional checks without rework, hand fitting, or repeated adjustment, divided by assemblies entering the defined process. This is a proposed operational definition for this article, not a quoted standard requirement.
Record failure categories alongside that measure. “Failed assembly” is too broad to guide corrective action. Distinguish insertion difficulty, fastener alignment, leakage, excessive torque, and other relevant symptoms. Link the affected components to supplier lots and inspection records.
High final yield achieved through sorting or hand fitting can hide weak interchangeability. Conversely, poor assembly yield does not establish supplier fault until mating components, assembly tooling, and specifications have been evaluated.
Action: Review capability with its raw data and process context, then track assembly first-pass yield separately using agreed test boundaries and traceable failure categories.
5. A Useful Quality Agreement Connects Function, Measurement, and Response
A functional quality agreement refers to a buyer-supplier control plan that links assembly requirements with manufacturing controls, verification methods, traceability, and abnormality response.
The agreement should make quality evidence usable during production and investigation. AIAG’s core-tools framework connects planning, risk analysis, production approval, measurement systems, process control, and control plans rather than assigning the whole task to final inspection. [AIAG — Quality Core Tools]
For a machined component, start with its interfaces. Identify what prevents assembly, creates leakage, allows movement, or causes premature functional failure. Then connect those outcomes to drawing requirements and suitable verification tasks.
A practical review record can use the following format:
| Functional concern | Control question | Release evidence |
|---|---|---|
| Shaft fit | Are size and relevant geometry controlled? | Appropriate measurements and validated fit checks |
| Fastener alignment | Is the hole pattern related to assembly datums? | Positional verification or suitable functional gauging |
| Thread engagement | Is the required thread condition verified? | Agreed gauging and depth checks |
| Sealing | Are relevant surface and geometry requirements covered? | Measurements and specified functional testing |
| Product identity | Is the correct material and revision supplied? | Traceable identity and process records |
These are proposed engineering review prompts. The actual acceptance requirements must come from the component’s design and application.
Measurement suitability needs its own evidence. Calibration alone does not explain whether a measurement task reliably distinguishes acceptable from unacceptable parts. Review the method, datum setup, operator influence, fixture, and relevant measurement-system studies. AIAG identifies measurement-system analysis as a core quality tool. [AIAG — Quality Core Tools]
Functional checks can be powerful, but their scope also needs definition. A successful trial using a single convenient mating component may not represent allowed mating-part variation. State what the check demonstrates and validate the gauge or test method for that purpose.
Next, agree on change notification. The buyer should know when changes could affect approved interfaces or invalidate the existing evidence. The supplier should know which changes require approval and which require documented internal verification.
Finally, make corrective action measurable. Require the investigation to connect the assembly symptom, affected production population, root cause, containment, and verification of the correction. Closing a report without checking subsequent functional results leaves the commercial problem unresolved.
This approach can reduce unnecessary inspection as well as improve protection. Strong evidence may justify focusing resources on the features and process conditions that actually drive failure. Weak evidence points to where additional control is needed.
The goal is dependable interchangeability supported by records that explain what happened when a problem occurs. Buyers gain more from that connection than from an unexplained promise that every component has been inspected.
Action: Attach a functional control plan to the quality agreement and make final release depend on defined evidence, traceable production status, and a workable abnormality response.
Preguntas frecuentes
A: No. It supports the verified characteristics of the submitted sample under the evaluated conditions. Continued conformity requires controls covering later production and relevant changes.
A: Yes. In the hypothetical lot containing 20 nonconforming parts among 1,000, randomly inspecting 80 without replacement gives approximately an 18.56% probability of finding none.
A: No. AQL helps define an acceptance system; it is not a measurement of the accepted shipment’s actual defect proportion.
A: It can improve containment for a specified defect when the detection method is effective. It still requires clear characteristic coverage and does not remove the need for process control.
A: No. It concerns the analyzed characteristic and dataset. Assembly also depends on other interfaces, mating components, requirements, and operating conditions.
A: Request the failed parts’ traceability, final-condition measurements, inspection-method details, production sequence, and controlled functional reproduction. Use that evidence to establish containment and investigate component, specification, and assembly causes.